Learn to think globally and act locally
The Global Citizens’ Initiative equips people and organizations with the knowledge, skills, and connections to respond to global challenges within their own communities and across borders.
From human rights and poverty to climate change, our courses and resources help people turn global awareness into meaningful action.

Many ways to get involved
Donate today!
Learn more about why you should donate to TGCI
The Global Citizens’ Initiative brings together people and organizations from different countries to combat the global problems that confront all countries—problems such as climate change, poverty, and human rights. Click here to learn more and donate today.
Become a member
Becoming a member is free and easy. Join a community of like-minded people.
Follow us on social media!
Stay connected with us on our social media channels!
The Global Perspective Series
The series, written by TGCI Director Ron Israel, examples different global issues from the perspective of What would the whole world do? In other words, how could this issue best be addressed if we take the interest of the entire planet into account.
Country Global Citizenship Report Card
See the status of your country’s ability to collaborate with others.
Deepen your understanding
What you need to know about the events, activities, and ideas that are shaping our world.
Different Ways of Looking at the World
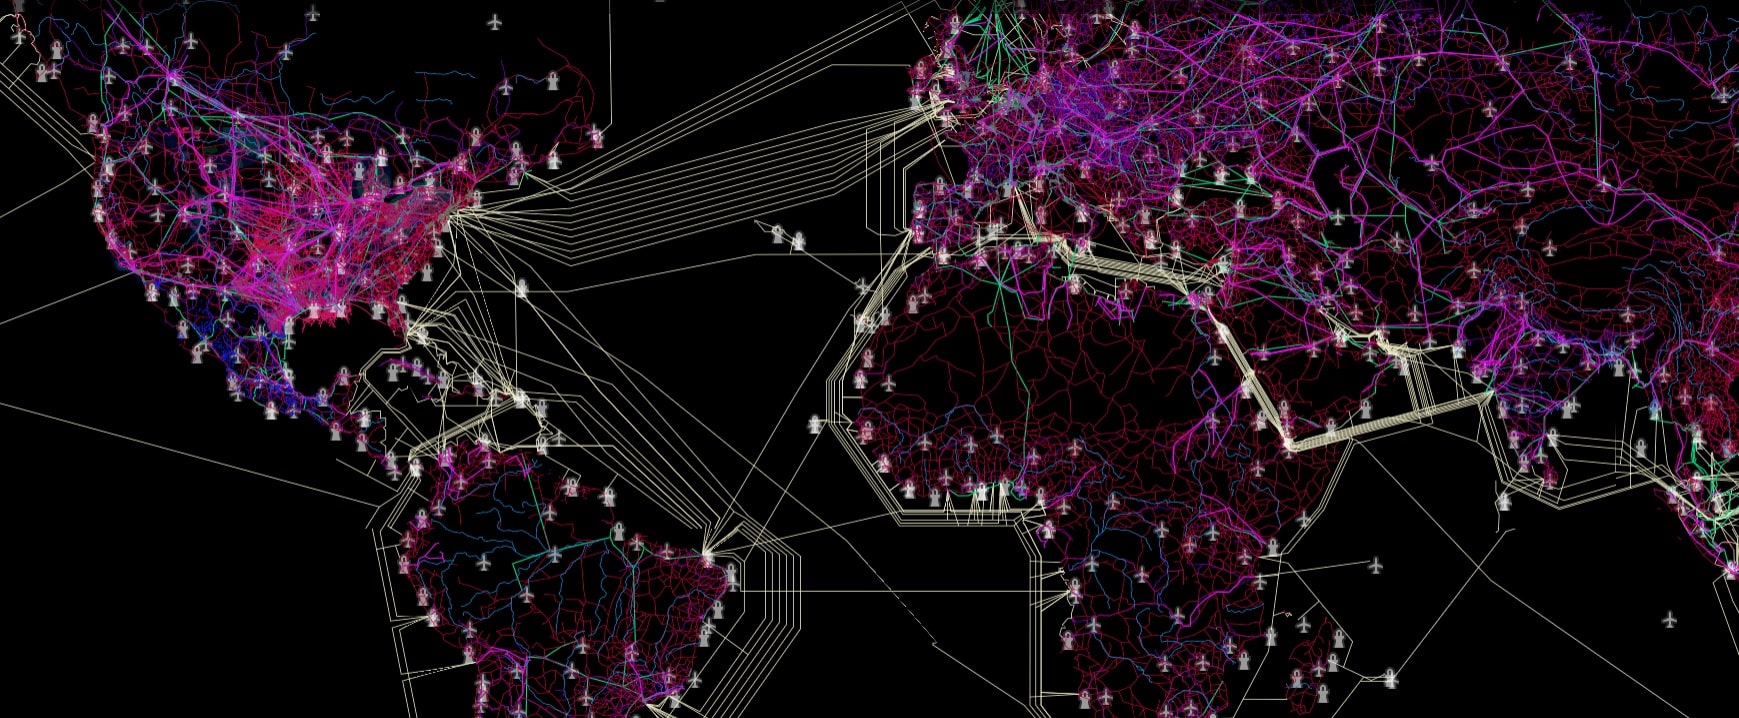
Connectivity Atlas
Infrastructure connects us and defines us. The roads, pipelines and Internet cables that deliver our services also shape our opportunities, our vulnerabilities, and our identities. Political and geographic maps abound – yet there are few useful, elegant maps of the complex infrastructure that ties us. The Connectivity Atlas invites you to explore the shapes and lines that advance our global connectedness. We believe that great insight lies in these maps.
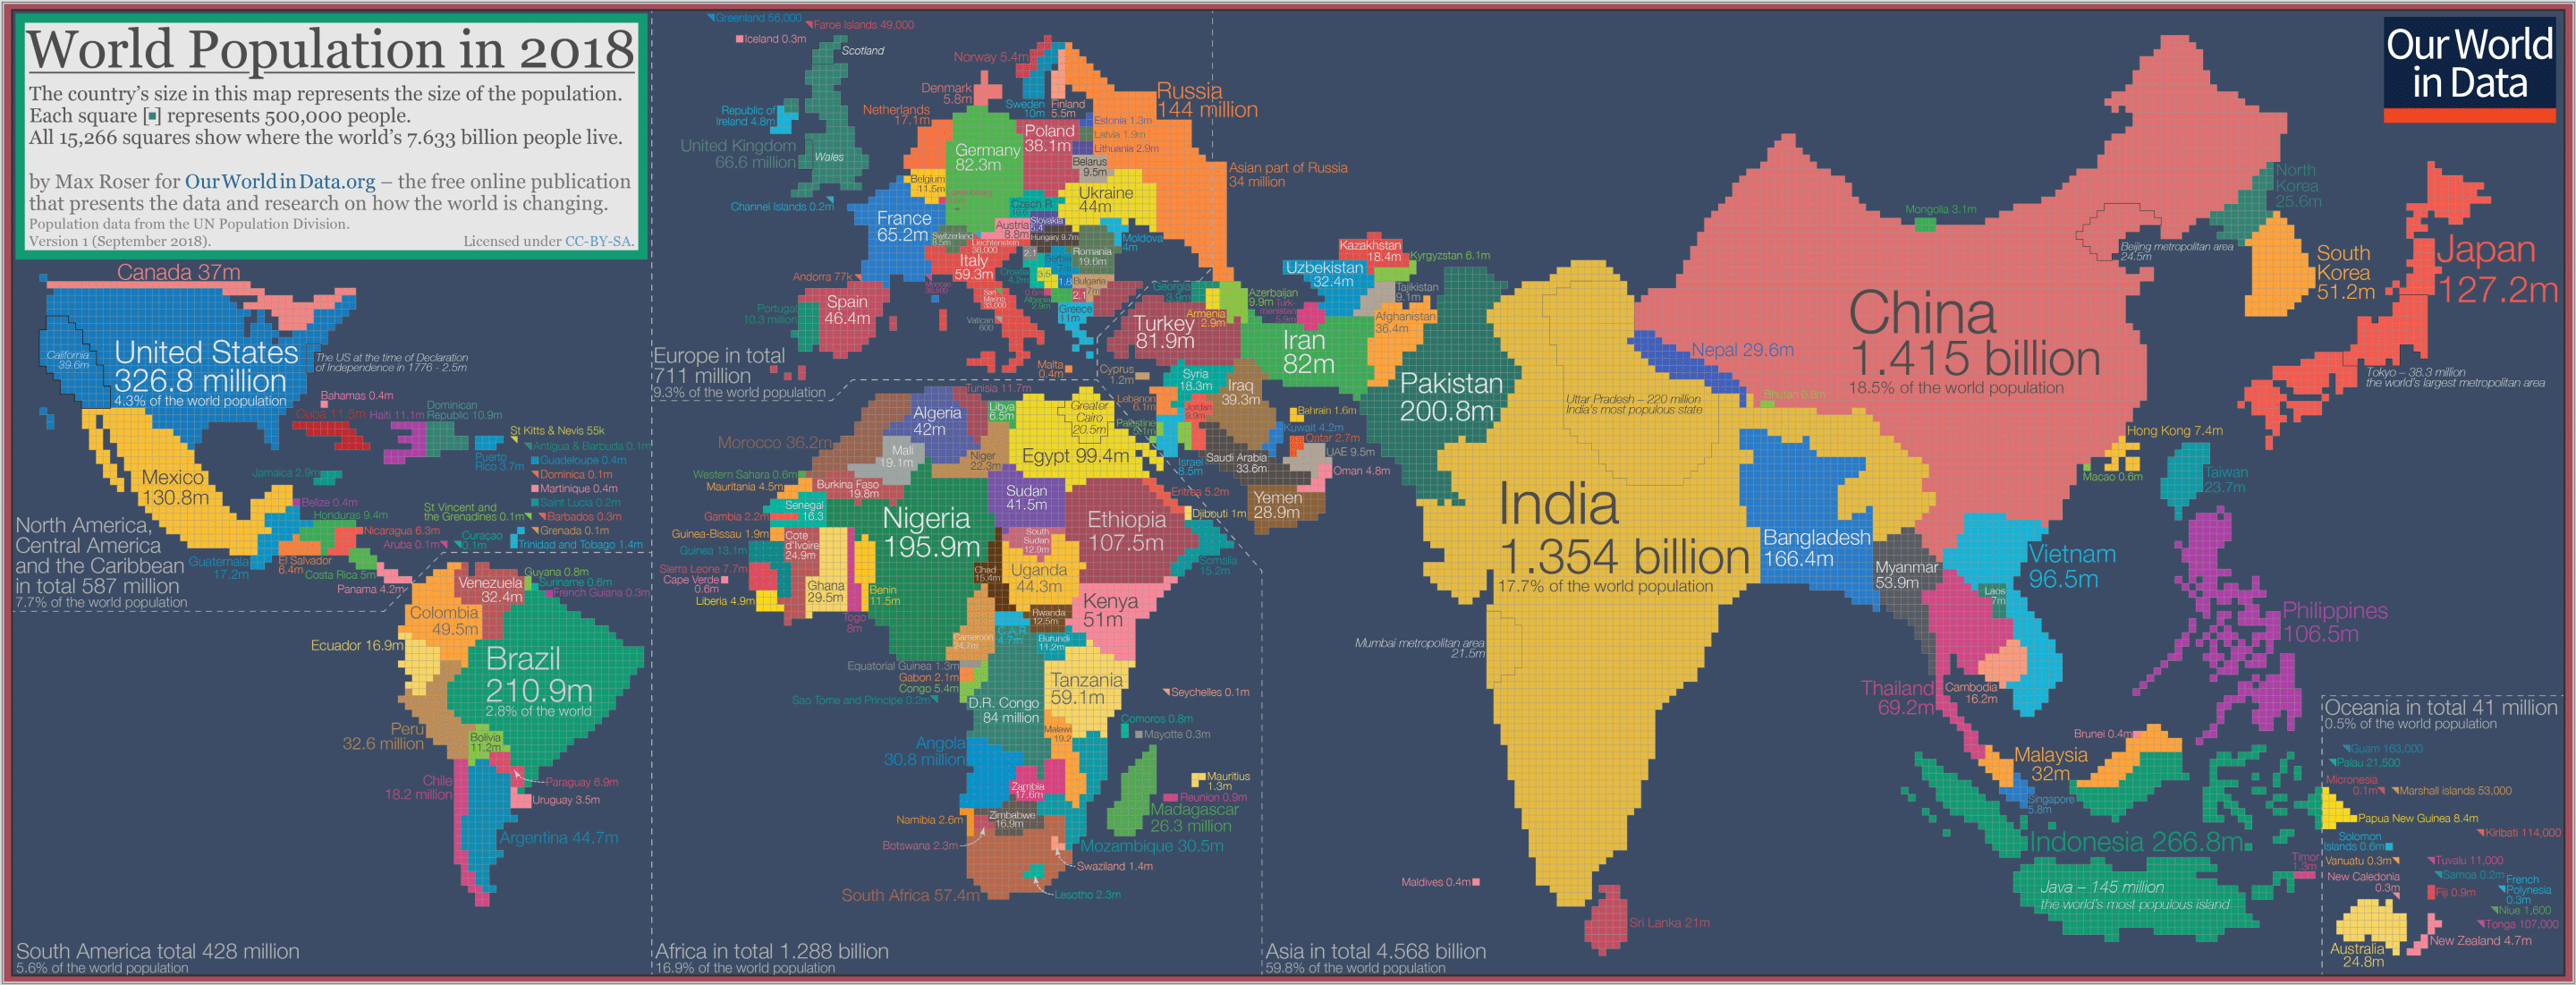
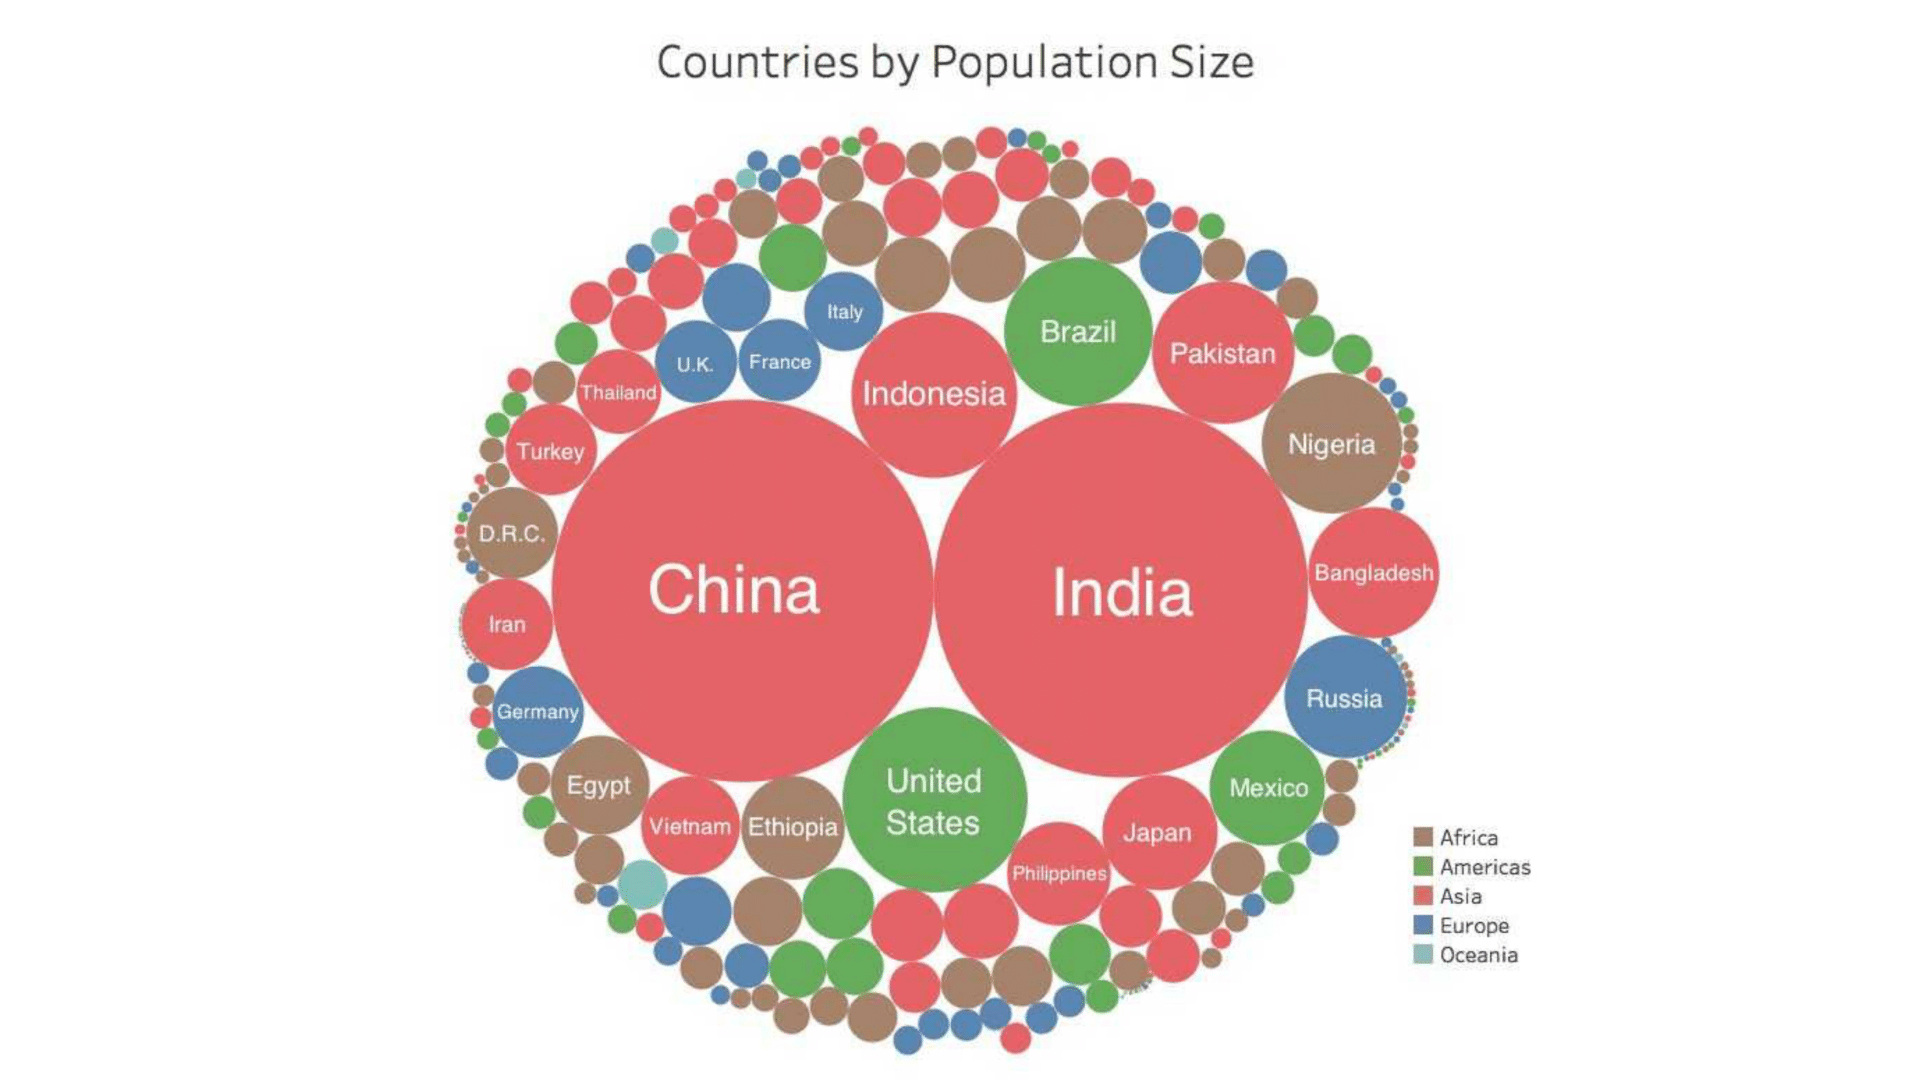
Population Cartogram
Our World in Data developed this cartogram for the world population in 2018 to show how living conditions around the world are changing. The cartogram is made up of squares, each of which represents half a million people of a country’s population. The 11.5 million Belgians are represented by 23 squares; the 49.5 million Colombians are represented by 99 squares; the 1.415 billion people in China are represented by 2830 squares; and this year’s entire world population of 7.633 billion people is represented by the total sum of 15,266 squares. Visit the site to learn more about how global living conditions are changing.
Partners and Supporters